 The common approach for pricing water and other goods and services in a market economy is uniform pricing: each unit is priced the same regardless of the amount consumed and the characteristics of the consumer. Block (or tiered) rate pricing is where the cost per unit varies with the amount consumed. Increasing (decreasing) block rates refer to the case when the first units are priced relatively low (high) and subsequent units are priced higher (lower), so that the price per unit rises (falls) with consumption in a stepwise manner.A “volume discount” is an example of decreasing block rate pricing.
Allocation-based water pricing is an innovative type of increasing block rate price structure in which the block sizes vary according to the characteristics of the consumer. Under an allocation-based rate structure, the block sizes are based on household-specific characteristics (e.g., number of residents, irrigated area, unusual circumstances such as medical need), environmental conditions (e.g., evapotranspiration), and a judgment by the water utility regarding what constitutes “efficient” use given those characteristics and conditions. This means that price structures can differ across house- holds at any point in time, and through time for any household. A household’s efficient level of use is called its “water budget,” and thus, a household that consumes beyond its budget is deemed to be using water inefficiently.

Tractors kick up dust in the Imperial Valley, where rainfall averages three inches a year. Irrigation enables California’s farmers to grow half of all U.S. vegetables, fruits, and nuts. Photo: Edward Burtynsky for National Geographic, 2010.
Adoption of Allocation-Based Rates
Allocation-based rates are thought to have significant advantages over uniform and fixed block rate structures. Foremost, allocation-based rates are thought to provide a strong conservation incentive because the block sizes depend on household characteristics. Therefore, all households face higher prices as consumption increases, whereas smaller households rarely enter the upper blocks under fixed block rate pricing. The Irvine Ranch Water District reports that in the 13 years following the introduction of allocation-based rates in the early 1990s, average per-acre outdoor water use declined by 61%.
Allocation-based rates also address equity concerns by providing each household — regardless of size — with a block of low-priced water that should satisfy the most essential uses, such as drinking, cooking and cleaning, while charging higher prices for presumably less essential uses such as landscaping. The highest prices are paid only by those households that exceed their designated water budgets, with already efficient households remaining largely unaffected by the higher rates. Allocation-based rates thus should be more politically acceptable than fixed block rates due to their perceived fairness.
Despite these advantages, adoption of allocation-based rates has been relatively slow in California. As of 2011, whereas about half of all utilities had implemented block rate water pricing, only around 25 had adopted allocation-based rate structures. The main concerns appear to be the cost of developing such a rate structure, whether the rate structure will help or hinder efforts to balance revenues with costs, the extent to which the rate structure reduces demand for water, and the differential effects of the rate structure across households.
__________________________________________________________________________________
This article was originally published by Ken Baerenklau, Kurt Schwabe, and Ariel Dinar in ARE Update, Vol.17, No. 6, July/Aug, 2014. The issue can be accessed by clicking HERE. The ARE Update is a bimonthly magazine published by the University of California Giannini Foundation of Agricultural Economics for the purpose of providing wide dissemination of research results and expert opinion from faculty and graduate students in agricultural and resource economics at UC Davis and UC Berkeley.
__________________________________________________________________________________
Demand Reduction Effect
Because multiple competing factors that fluctuate through time influence water demand, the demand effect of a rate structure change cannot be determined simply by observing the effects of introducing a rate structure on demand changes. For example, changes in the broader economy can drive per-capita water demand up or down as prices and incomes fluctuate. Changes in weather and climate, such as cyclical precipitation patterns or regional temperature trends, are important drivers of outdoor water use.
Changes in the availability of, and preferences for, water conserving technologies (such as climate-controlled irrigation systems and low-flow toilets and shower heads) can reduce demand. And even population growth can reduce per-capita demand if new homes must be built with such water-efficient technologies. But of course none of these demand effects should be attributed to the chosen rate structure.

Southern California draws much of its water from the Sacramento-San Joaquin Delta, which was diked and divided into farms more than a century ago. Many of the aging levees are at risk of failure. Photo: Edward Burtynsky for National Geographic, 2010
To properly identify the effect of allocation-based rates on demand, as well as the differential effects across households, we must account for these competing factors. We accomplished this by utilizing household consumption data from the Eastern Municipal Water District of Southern California (EMWD). EMWD is a member agency of the Metropolitan Water District of Southern California and serves a diverse region of western Riverside County that includes the cities of Moreno Valley, Perris, Hemet, Murrieta, and Temecula. This region covers 542 square miles and has a population of more than 768,000. EMWD provides around 90,000 acre-feet of water to approximately 137,000 domestic water service accounts and a much smaller number of agricultural and irrigation users.
EMWD switched from uniform to allocation-based rates in April 2009. The allocation-based rate structure includes four blocks: (1) efficient indoor use, which is primarily a function of household size; (2) efficient outdoor use, which is primarily a function of irrigated area and evapotranspiration requirements; (3) excessive use, which is 50% of the combined indoor and outdoor block sizes; and (4) wasteful use, which accounts for consumption in excess of block 3. The sum of blocks 1 and 2 deter- mine a household’s water budget.
In 2008, under uniform rates, the nominal price was $1.85 per 100 cubic feet of water. In 2014, under allocation-based rates, nominal prices ranged from $1.73 for block 1, up to $10.36 for block 4. Both rate structures were designed to balance revenues with costs over the long run.
 To estimate the effect of the rate change on household demand, we identified 12,000 single-family households in EMWD’s service area with continuous monthly water use records from January 2003 through April 2014 and no tenancy changes. We used the uniform pricing data from 2003–2008 to estimate a statistical model of household demand that accounts for household size, irrigated area, evapotranspiration requirements, water price, household income, and other relevant factors.
Next we used this model to predict what household demand would have been if EMWD had not switched to allocation-based rates, but had instead maintained uniform rates and set them equal to the average prices paid under allocation-based rates from 2009–2014. We then compared these predictions against observed household demand under allocation-based rates and used the difference between them as an estimate of the demand reduction effect of the allocation-based rates.
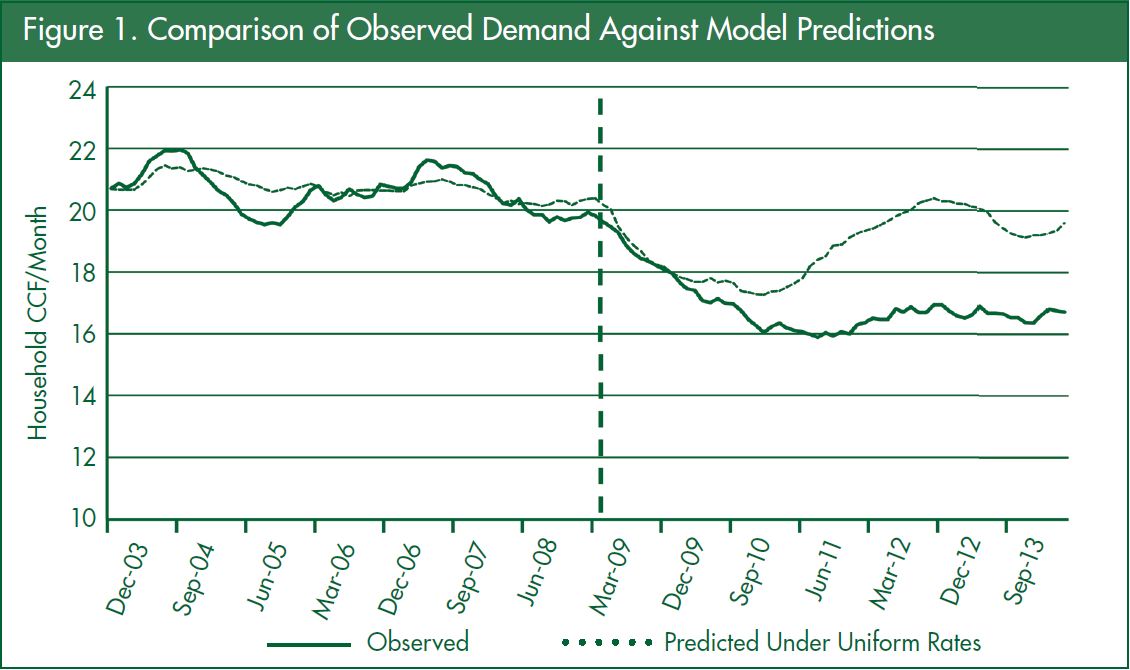
Figure 1 shows the results of this comparison for the entire observation period from 2003–2014, using 12-month moving averages to smooth out the seasonal fluctuations in demand. The vertical dashed line corresponds to the change in rate structure in April 2009. To the left of the dashed line, the model performs reasonably well in predicting demand when uni- form rates were in effect. But there is a significant divergence between observed and predicted demand to the right of the dashed line, which indicates the introduction of allocation-based rates. Observed demand fell and remained low, while our model predicts that under equivalent uniform rates, demand would have fallen less, leveled off sooner, and climbed back up to about where it was just before the rate change.
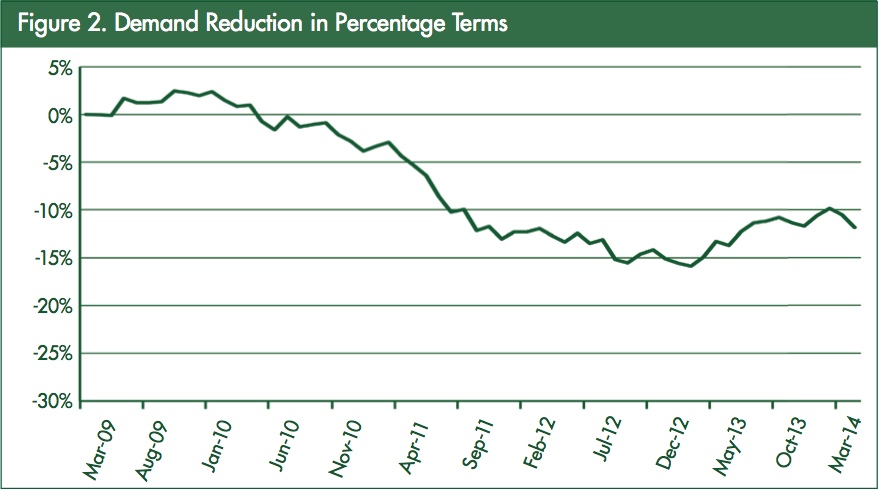
 The gap that emerges between observed and predicted demand after April 2009 in Figure 1 is our estimate of the demand reduction effect of the allocation-based rates. Figure 2 shows this effect in relative terms, again using 12-month moving averages to smooth out the seasonal fluctuations in demand. As the figure shows, one year after the rate change (as of April 2010) there was very little observable effect. But two and a half years after the change, around September 2011, average household water use was about 10% below where it would have been under equivalent uniform rates. Since then, the demand effect has fluctuated but has remained in the 10-15% range for nearly three years.
Moreover, the average price paid for water under allocation-based rates rose less than 4% in real terms since April 2009, but our model predicts that a uniform price would have had to rise around 30% to achieve the same observed reduction in demand. This again speaks to the strong conservation incentive provided by this allocation-based rate structure, as well as its cost-effectiveness for households.
Differential Effects Across Households
 As with any change in pricing policy, a shift from uniform to allocation- based rates will have differential effects across households. One concern is how such a change may impact lower income households. If such house- holds end up facing significantly higher prices than they did under uniform pricing, concerns about equity and fairness may hinder adoption of allocation-based rates despite their apparent conservation potential. For our sample, this does not appear to be a concern. The average prices paid by households with incomes in the lower third of our sample actually declined under allocation-based rates, but their usage also declined, presumably in response to the threat of higher prices in the upper blocks. These households are now using less water and paying less per unit.
The way in which the estimated demand reduction has been distributed across households is a related question. As mentioned previously, an important motivation for adopt- ing allocation-based rates is the belief that they tend to reduce consumption by inefficient households without penalizing the already efficient house- holds. To assess the extent to which this happened in EMWD’s service area, we used EMWD’s formula for the volumetric block sizes to estimate water budgets for 2008, before the rate change. We compared the observed consumption of our sample house- holds against these hypothetical water budgets to develop a relative measure of efficiency. We then ranked the households according to this measure and divided them into three groups: efficient (top third), average (middle third), and inefficient (lower third).
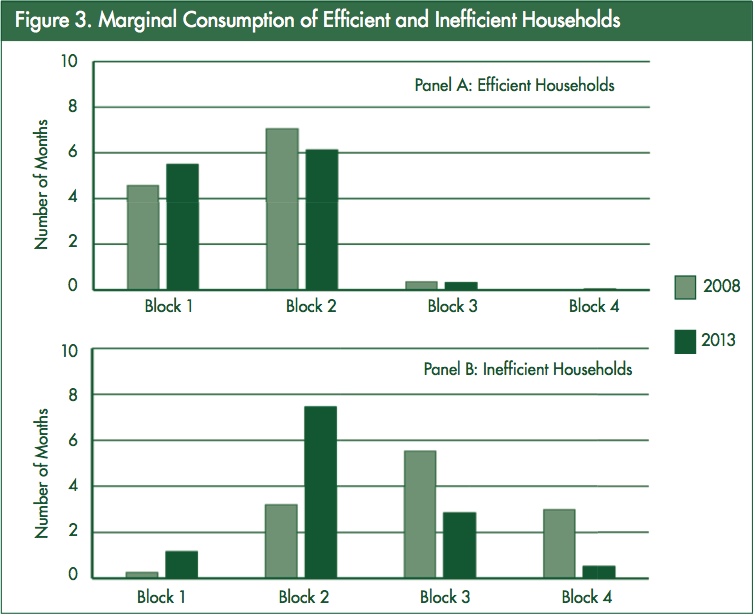
Figure 3 shows how the efficient and inefficient households responded to the allocation-based rates. The figure shows the number of months in which marginal consumption for each group was in each of the four blocks. From 2008 to 2013, the efficient households (Panel A) did
not alter consumption very much: on average these households consumed within their estimated water budgets (blocks 1 and 2) for more than 11 months in each of these years.
 But the inefficient households (Panel B) show a much larger response to the rate structure change. In 2008, these households consumed within their estimated water budgets for less than four months, whereas they did so for more than eight months in 2013. Apparently the allocation-based rates have caused these households to become much more efficient while affecting the already efficient households very little.
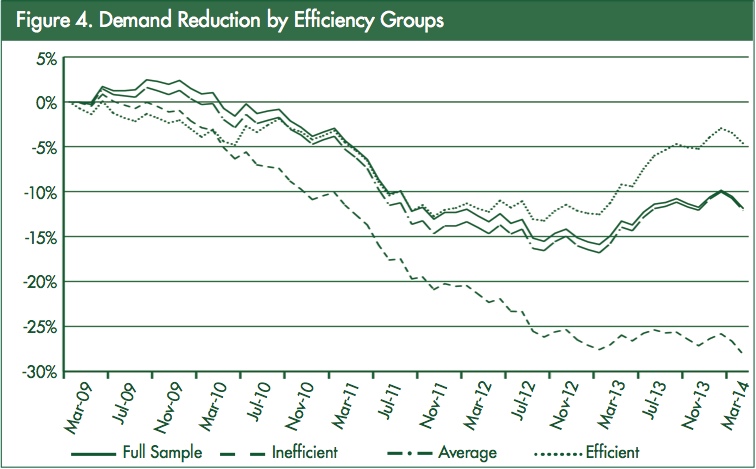
Figure 4 shows how the group-specific household demand effects have evolved through time. Not only have the allocation-based rates had a larger effect on inefficient households, but the demand reductions by these households also appear to be more resilient com- pared to the other groups. The figure shows that the inefficient households are the only group that has not experienced a reduction in the demand effect since 2012, while the demand effect for the already efficient households has decreased significantly from 13% to 5%.
Conclusions
The results of our study suggest that allocation-based rates can be a highly effective and equitable conservation tool for water utilities, although a substantial amount of time is required for the full extent of the demand reductions to be realized. For water utilities that are considering adopting allocation-based rates, this study provides support for doing so, with the caveat that conservation goals may take years to achieve.
Although speculative, the observed time lags could be the result of house- holds gradually learning how to respond to higher marginal water prices by reassessing old water use habits and developing new ones. This also would be consistent with the reduction in observed demand in figure 1, which remains relatively stable even when the predicted demand rebounds significantly. If true, then efforts to promote quicker re-learning of water consumption habits should hasten the attainment of conservation goals, but exactly how to go about doing this is a topic for future work.
A potentially fruitful line of new research would be to investigate the extent to which non-price instruments and/or neighborhood effects influence learning and habit formation. Some water utilities have begun reporting local average water consumption on individual bills to give households a better idea of how their consumption compares to a relevant peer group.
Such information, combined with a high marginal price for “excessive” water use, could prove to be a highly effective approach to encouraging urban water conservation.

