 Climate is of paramount importance to winegrape growing. The seasonal pattern of sunlight, temperature, rainfall, and humidity influences both above ground and below ground vineyard environments. It sets the length of growing seasons and influences the likelihood of cold damage. Climate is the principle driver of seasonal vine growth and development, including fruit ripening and the development of sensory characteristics in grapes. Almost as important, climate affects the incidence, life cycles, and severity of grapevine pests and diseases. In this article we will look at a few aspects of climate important to California winegrape growing.
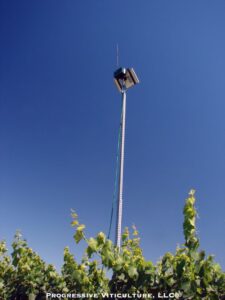
Fig. 1. Vineyard managers increasingly use weather stations to monitor atmospheric conditions, including degree days. Photo source: Progressive Viticulture, LLC ©
Regional Degree Days
The seasonal summation of daily temperatures above 50°F, known as degree days, is the traditional method for assessing grape growing climates. Long-term average degree-day values are divided into 5 classes called regions, with Region I the coolest (< 3000 degree days) and Region V the warmest (> 4001 degree days). For example, Placerville has a Region II, Livermore a Region III, and Lodi a Region IV climate.
Modeling, automated weather stations, and other refinements have improved degree day values since the concept was presented in 1944 (Fig. 1). Still, degree days suffer from a few limitations. One will be highlighted in the next section.
California Versus the World
Seasonal degree-days for Napa (2482) are similar to those of Angouleme in the Cognac region (2516), but that may be the only similarity between Napa’s climate and that of the central coast of France. Importantly, Napa receives about 47% more sunlight than Angouleme (2118 vs. 1442 sunlight hours).
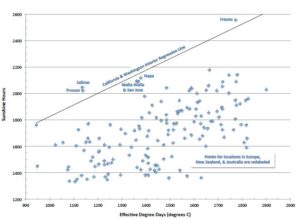
Fig. 2. Average sunshine hours versus average effective degree days.
Data source: Gladstones, J. 1992.
Prepared by Progressive Viticulture, LLC ©
Actually, an abundance of sunlight hours is what differentiates California and eastern Washington from other wine grape growing areas of the world (Fig. 2). It is also the reason why some canopy management practices that work well elsewhere are associated with sun damaged fruit in our climate. In addition, ample sunlight likely affects the sensory characteristics of California grapes and wines, differentiating them from most other winegrowing regions in the world.
Sunlight within California
Sunlight hours vary within California. With their relatively high frequency of fog and clouds, coastal California locations generally receive fewer and more variable sunlight than interior locations (Fig. 3).
Differential sunshine hours influence vineyard water use, which leads us to our next topic.
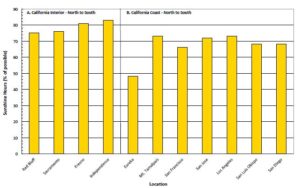
Fig. 3. Average annual sunshine hours for selected locations in (A) the California interior and on (B) the California coast.
Data source: U. S. Weather Bureau.
Prepared by Progressive Viticulture, LLC ©
Evapotranspiration (ET), another Regional Climate Parameter
Sunlight is a principal driver of vineyard water use. Heat transfer with air movement (advection), whether horizontal or vertical, is a secondary ET factor.
Water use or more precisely, the loss of water due to the combination of evaporation from the soil surface and transpiration through vine tissues, is represented in a single numerical value as evapotranspiration or ET in (acre) inches of water. Grape ET is often less than the potential ET or atmospheric demand for moisture because grapevines seldom receive all of the water they could use.
It is important to remember that not all vineyard water is lost to atmosphere. A significant portion hydrates tissues or is consumed during photosynthesis and incorporated into vine tissues. Sunlight and temperature drives this process, too.
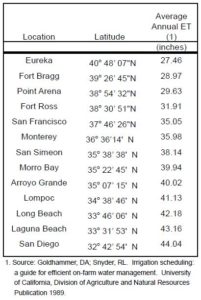
Table 1. California coastal average seasonal
reference evapotranspiration (ET) – north to south.
Data source: Goldhammer, DA; Snyder, RL 1989.
Prepared by Progressive Viticulture, LLC ©
Regional ET
Seasonal total evapotranspiration generally varies with latitude, increasing from north to south (Table 1). In California, it also increases from the coast to the interior (Fig. 4).
Not only does total ET differ between the California coast and interior, but so does the seasonal ET pattern. In coastal regions, ET increases between February and June, changes little between June and August, and then decreases from September to December. In the interior, ET continuously increases until reaching a July peak and abruptly decreasing.
There are some variations to these regional trends. For some reason, July ET is depressed compared to June and August in Atascadero and Arroyo Grande. In Salinas and King City, the seasonal peak is askew, occurring in August. June ET is depressed in Martinez, Brentwood and Lodi. In addition, the Lodi peak extends between July and August.
These regional ET variations have significant implications for grapevines. Its principal elements, sunlight and temperature drive physiological processes (e.g. photosynthesis, respiration, and other metabolic activities). As a result, vineyards in regions of higher ET have greater capacities for vine growth, fruit production, and ripening than vineyards in areas of lower ET, and of course, they use more water.
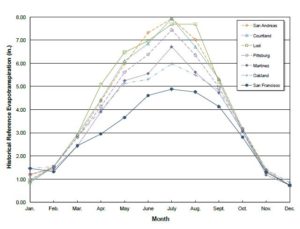
Fig. 4. Average monthly reference evapotranspiration (ET)
for a Bay-Delta-Foothill transect of selected locations
Data source: Goldhammer, DA; Snyder, RL 1989.
Prepared by Progressive Viticulture, LLC ©
A Regional Climate Parameter Limitation
Temperature alone (degree days) and the combination of sunlight and temperature (ET) are useful for comparing grape growing regions. However, they share a weakness that somewhat limits their value in vineyard management. That weakness is they assume all temperature values above 50° F are equally effective. In other words, they assume vine responses to changes in their environment are linear.
This, of course, is untrue. Vine growth and development is slow early in the growing season on cloudy days with temperatures near 50° F. Vine metabolism also slows as temperatures and solar radiation rise to stressful levels (> 95° F) later in the season. Clearly, vine responses to atmospheric conditions are curvilinear.
Conclusions
California wine growing climates are varied, but at the same time they are different from most other grape growing areas in the world. These facts are reflected in the characteristics of California vineyards, grapes, and wines.
This article was originally published in the Mid Valley Agricultural Services August 2016 newsletter.
To subscribe to the Coffee Shop Blog, send an email to stephanie@lodiwine.com with the subject “blog subscribe.”
To join the Lodi Growers email list, send an email to stephanie@lodiwine.com with the subject “grower email subscribe” or click on “join our email list” to the right.
To receive Lodi Grower news and event promotions by mail, send your contact information to stephanie@lodiwine.com or call 209.367.4727.
For more information on the wines of Lodi, visit the Lodi Winegrape Commission’s consumer website, lodiwine.com.
Further Reading
Amerine, MA; Winkler, AJ. Composition and quality of musts and wines of California grapes. Hilgardia. 15, 493-675. 1944.
Gladstones, J. Viticulture and environment. Winetitles, Adelaide. 1992.
Goldhammer, DA; Snyder, RL. Irrigation scheduling: a guide for efficient on-farm water management. University of California, Division of Agriculture and Natural Resources Publication 1989.
Grant, S. Five-step irrigation schedule: promoting fruit quality and vine health. Practical Winery and Vineyard. 21(1):46-52 and 75. May/June 2000.
Harbertson, JA; Hodgins, RE; Thurson, LN; Schaffer, LJ; Reid, MS; Landon, JL; Ross, CF; Adams, DO. Variability of Tannin Concentration in Red Wines. Am. J. Enol. Vitic. 59, 210-214. 2008.
Jackson, DI: Lombard, PB. Environmental and management practices affecting grape composition and wine quality – A review. Am. J. Enol. Vitic. 44, 409-430. 1993.
Keller, M. The science of grapevines. Academic Press, Burlington, MA. 2010.
Smart, R. and M. Robinson. Sunlight into wine: A Handbook for Winegrape Canopy Management. Winetitles, Adelaide. 1991.
Williams, LE; Dokoozlian, NK; Wample, RL.. Grape. In B. Schaffer and P. C. Anderson (eds.) Handbook of environmental physiology of fruit crops. Volume I. Temperate crops. CRC Press, Boca Raton, FL. 1994.
Winker, AJ, Kliewer, WM, Cook JA, Lider, LA. General Viticulture. University of California Press, Berkeley. 1974.
