 Devising strategies for control of powdery mildew is a major focus of winegrape growers and pathology researchers. Many growers rely on nearby weather stations (such as a CIMIS station), the powdery mildew risk index, and other site-specific historical and seasonal metrics to determine the ideal time for a fungicide or sulfur spray. Some growers have purchased individual weather stations for their vineyards, but such an investment is thought to be cost prohibitive. However, it was shown in the early stages of use of the UC Risk Index that growers who purchased $5,000 weather stations paid for them in less than one growing season because the weather information helped them save on fungicide applications. When prorated out to the life of the machine, the instrument paid for itself many times over.
In an effort to provide growers with the benefits of a weather station without the high cost, our lab has been developing a virtual weather station network. Virtual weather stations drawn on weather data from nearby real weather stations to provide growers with weather and mildew index information for any location they choose. This network of virtual weather stations can be found at the UC IPM website. Users are able to create a virtual station in any location they choose by clicking on the map and the weather estimated for that site will be calculated based on weather from the surrounding region. This allows growers to determine mildew risk in their vineyards as well as see site-specific forecasted weather up to four days ahead. In the future, we can foresee that such technology can pinpoint environmental and ecological characteristics that increase disease risk for any specific diseases and insect pests, and can allow growers to determine multiple disease risks in one step. For example, we will be able to see how much the presence of an irrigation canal affects the powdery mildew, botrytis, and canker risk for a nearby vineyard, and for a vineyard far away. Ultimately, this technology will provide a nuanced and low-cost picture of weather information and disease risk in Lodi.
__________________________________________________________________________________
The research presented here is a product of Doug Gubler’s UC Davis lab, which specializes in the study and control of leaf pathogens in vineyards.
__________________________________________________________________________________
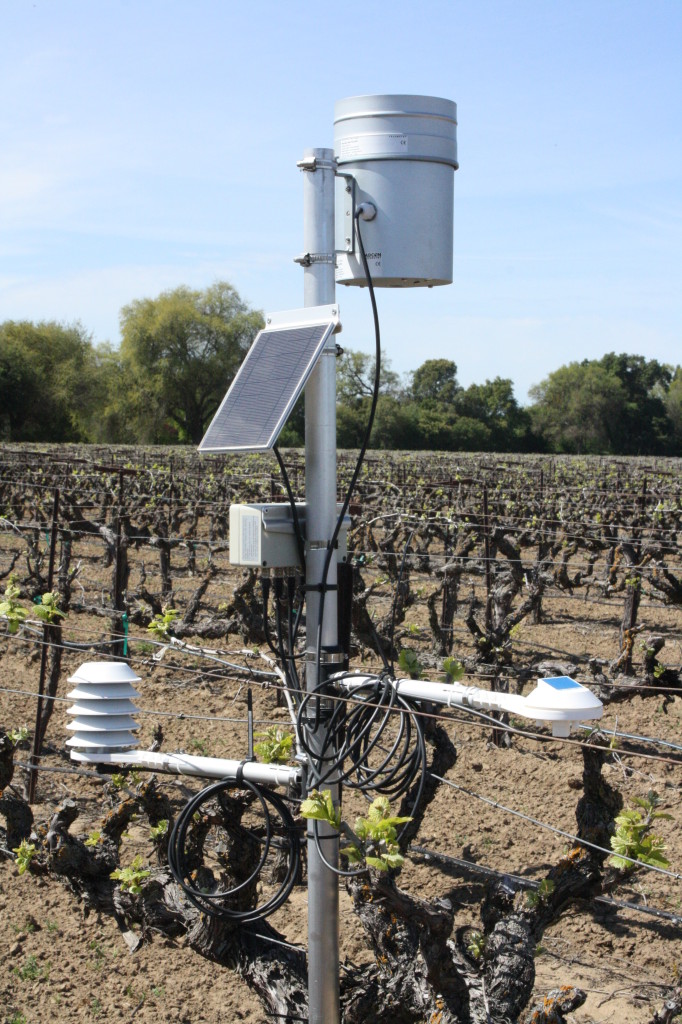
Figure 1: An example of how virtual and real weather conditions were calculated for a given site. The real station (pictured at left) was installed and gave actual readings for the site. The virtual station (output pictured at right) calculated the weather for every available station (except the installed, real station) within the grey ring and used it to estimate the weather at the site. Outputs were compared to determine how well the virtual station compared to the real station.
This virtual weather network is currently being validated in Lodi. To test the accuracy of virtual weather stations, we installed real weather stations within the same vineyards. The output from that vineyard’s physically present station did not factor into the virtual calculations for that vineyard, insuring that there was no contamination of the virtual weather predictions. Over the 2013 growing season, and continuing into the 2014 season, we worked with Lodi growers and PCAs to answer the following questions:
Virtual weather station related:
- How dense do virtual weather stations need to be to give reliable output for the entire Lodi area?
- How can we refine our powdery mildew model so that each virtual weather station gives consistent data for a given site?
- Will using this virtual station or an in-site station give different recommendations for fungicide applications than grower standard practice?
- Will the use of a virtual station save on tractor passes and amount of pesticide sprayed?
Powdery mildew related
- How genetically different are the populations of powdery mildew throughout Lodi?
- Can we survey vineyards and determine what genetic characteristics contribute to powdery mildew virulence, heat tolerance, and fungicide resistance?
- Can we pinpoint when ascospore release happens in Lodi?
Some Results from the 2013 Season
Virtual weather stations need to be at a higher density in Western Lodi (considered to be the study area west of highway 5), and proximity to bodies of water may need to become a weighted factor in the analyses of risk. A density of 1 weather station every 8 miles is suitable in areas east of highway 99 (considered Eastern Lodi in this study).
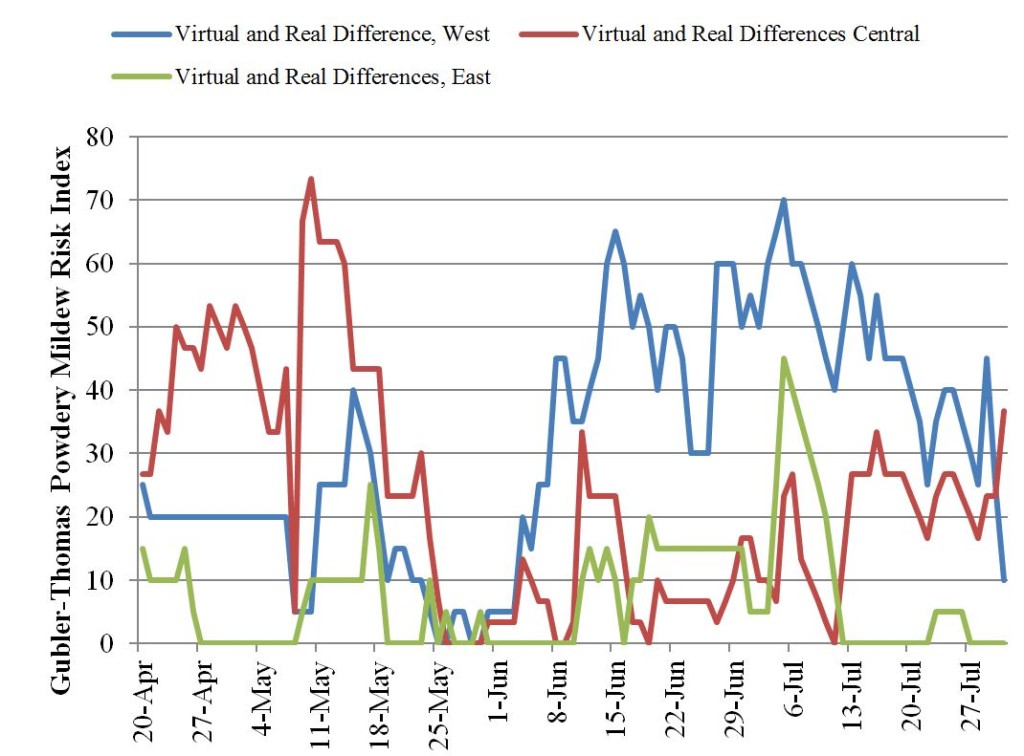
Figure 2: Comparison of virtual vs. real outputs in Western, Central, and Eastern Lodi. The difference in index between the virtual and real outputs for all stations were averaged based on their locations (Western considered to be sites west of highway 5, Central considered to be sites between 5 and 99, and Eastern considered to be sites east of 99). A higher number indicates that in that region, the virtual underpredicted the risk for a site when compared to the real weather station in the field. It is shown above that the area with the smallest difference between virtual and real stations was Eastern Lodi, a fairly geographically similar region. Central Lodi virtual stations underpredicted risk in April and May, whereas Western Lodi virtual stations underpredicted risk in June and July. This indicates that there are microclimates in Western and Central Lodi regions leading to this divergence.
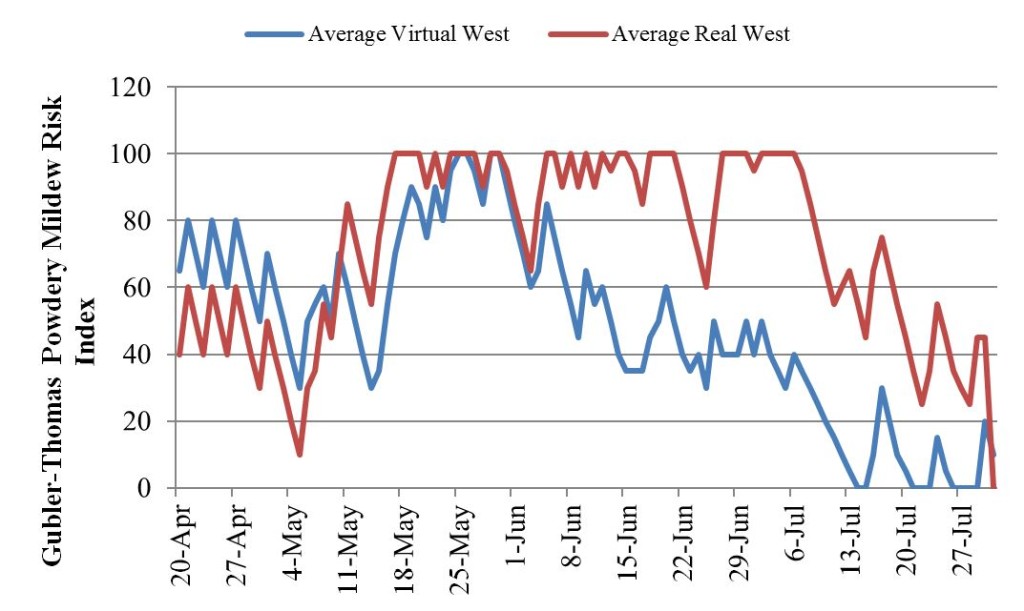
Figure 3: The virtual risk compared to the on-site recorded risk in Western Lodi. We can see here that the virtual stations were underreporting risk later in the season.
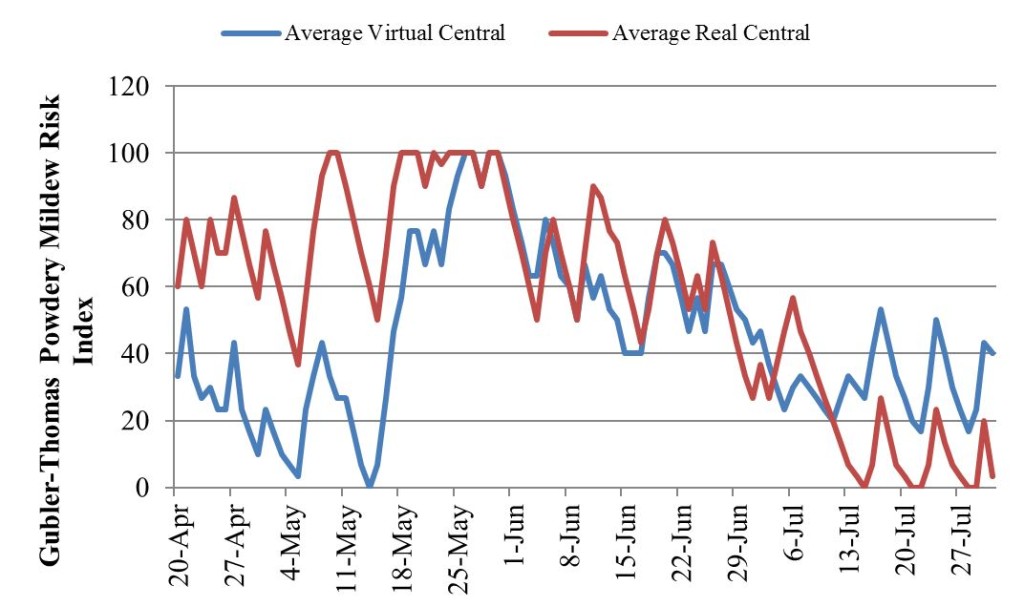
Figure 4: The virtual risk compared to the in-site recorded risk in Central Lodi. We can see here that the virtual stations were underreporting risk in the beginning of the season.
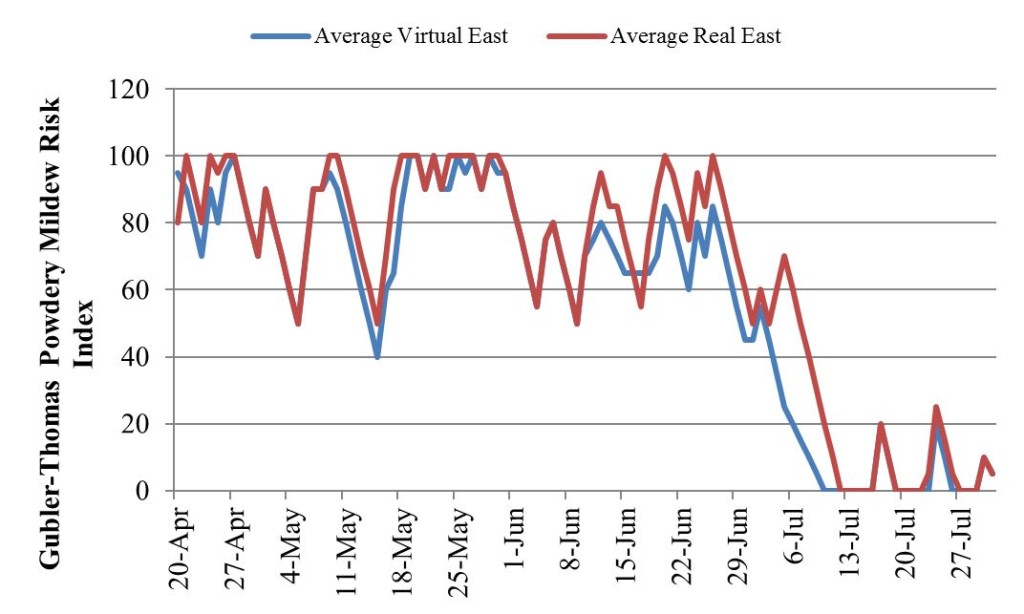
Figure 5: The virtual risk compared to the in-site recorded risk in Eastern Lodi. We can see here that the virtual and real stations were tracking throughout the season, indicating that the virtual weather station was correctly estimating weather conditions.
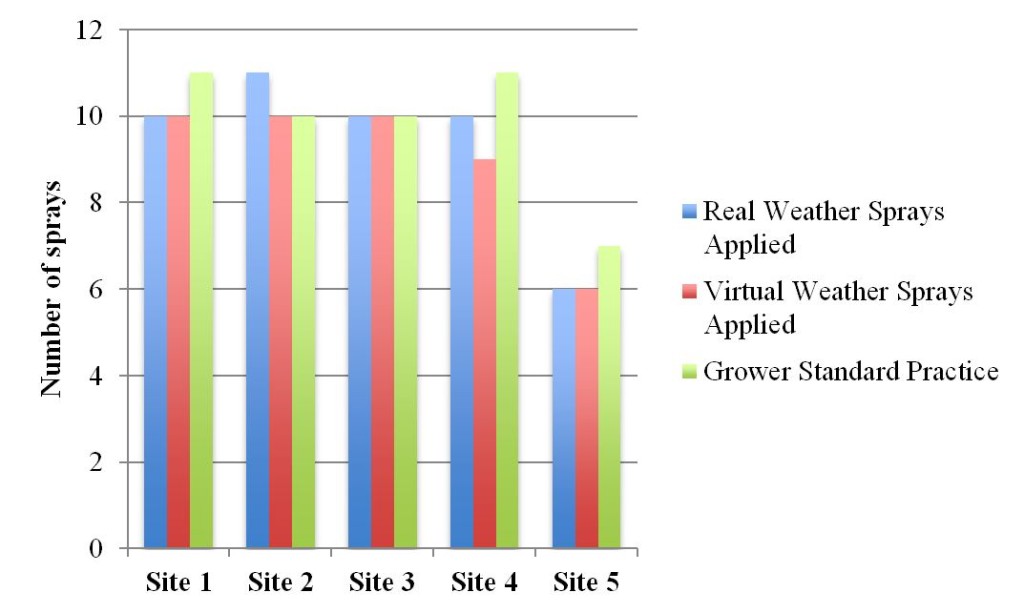
At about half of our sites, the use of the virtual and site-specific models saved 1 sulfur spray per season. Figure 6: Sprays applied to five of the study sites. Three of the sites had a reduction in sprays in areas of the vineyard that were treated by virtual and in-site weather when compared to grower standard practice.
At most of our sites, the use of a site-specific station to determine spraying frequency did reduce the amount of mildew by up to half, even if it did not reduce the total number of sprays applied. This is because it identified more precise timing of sprays to maximize spray efficiency. Figure 7: Severity (in percent) of mildew on clusters in Eastern Lodi for vineyard treatments based on grower standard practice (GS), virtual weather station indications (VWS), real weather station indications (RWS), all compared to a non-treated control, which shows the background mildew pressure (NTC). We see that there was very little mildew in any treated section, and that the maximum amount of mildew covered 22% of the most infected clusters.
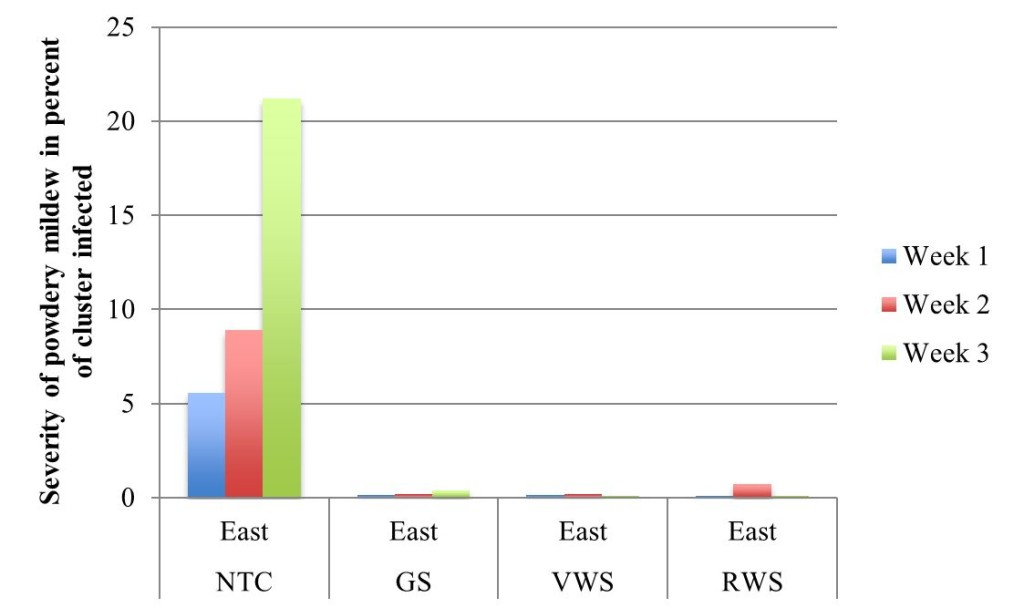
Figure 7: Severity (in percent) of mildew on clusters in Eastern Lodi for vineyard treatments based on grower standard practice (GS), virtual weather station indications (VWS), real weather station indications (RWS), all compared to a non-treated control, which shows the background mildew pressure (NTC).
Figure 8: Severity (in percent) of mildew on clusters in Western Lodi for vineyard treatments based on grower standard practice (GS), virtual weather station indications (VWS), real weather station indications (RWS), all compared to a non-treated control, which shows the background mildew pressure (NTC). We see a reduction in mildew severity in areas of the vineyard treated using a real and virtual weather station based spraying schedule compared to grower standard practice.
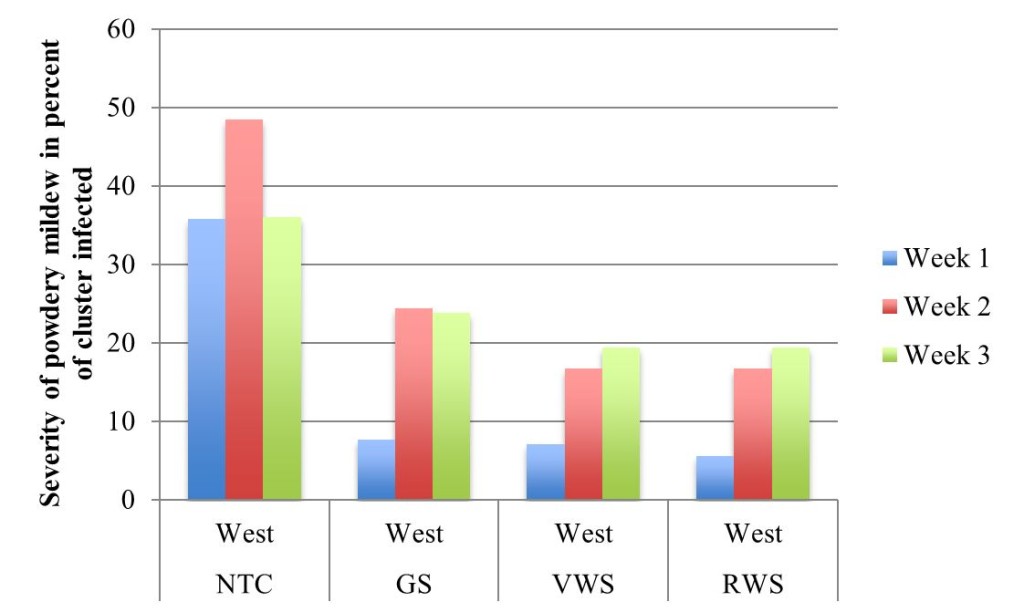
Figure 8: Severity (in percent) of mildew on clusters in Western Lodi for vineyard treatments based on grower standard practice (GS), virtual weather station indications (VWS), real weather station indications (RWS), all compared to a non-treated control, which shows the background mildew pressure (NTC).
For the 2014 season, we are continuing our spray trials on a smaller scale at fewer sites, and are focusing more on improving the virtual weather calculations and modeling technique. We will improve the algorithm to account for the heightened, local risk coming from furrow irrigation and canals. Additionally, we have deployed spore traps and will examine the airborne as well as leaf and cluster-bound microbial communities to learn more about the epiphytic characteristics of Lodi grapes that may contribute to “terroir”. We hope to serve grower concerns and address the many questions that are only possible with the collaboration of the growers and PCAs in Lodi.


