 Vineyards have two environments – one above ground and another below ground. The above ground environment is our visible domain where we can witness both atmospheric events and grapevine responses to them. In contrast, our ability to observe events underground, or at least infer them, is very limited, relying mainly on sensor readings, periodic analysis results for soil samples, and recognizable vine foliage responses to changes in soil conditions, such as soil moisture and nitrogen availability. Clearly, we need to access all available soil information to effectively manage our vineyard root zones.
County soil surveys are our primary sources of soil information. They are the products of the National Cooperative Soil Survey (NCSS) program, which the 53rd U. S. Congress initiated through legislation in 1896. The stated goal of the National Cooperative Soil Survey Program is understanding, managing, and conserving the soil resources of the US. Although the federal government leads the National Cooperative Soil Survey Program, it is typically a cooperative endeavor that involves state and local governments. Printed soil surveys are available at your local USDA Natural Resources Conservation Service (NRCS) office, but they are also available on-line at http://websoilsurvey.nrcs.usda.gov/app/. Soil surveys contain a vast amount of information, but only a portion is relevant to vineyards. Accessing this information is the focus of this article.
In soil surveys, soils are presented as soil mapping units in detailed maps, text, and tables. Soil mapping unit designations incorporate a soil series, topsoil texture, and phase features. Columbia sandy loam, drained, 0 to 2% slopes is an example of a soil mapping unit. The soil series, which was Columbia in the preceding example, is the most detailed class in the US soil classification system. It typically takes the name of the location where it was first described. Soil phases include slope, rock fragment content, drainage, erosion, and other mappable features.
This article was originally published in the Mid Valley Agricultural Services November 2014 newsletter.
Soil scientists delineate soil mapping units using their knowledge of parent rocks, landforms, relief, climates, and natural vegetation and how these factors influence soil formation. Aerial photos and soil cores aid the delineation process. Soil mapping units are general entities, which vary to some degree and commonly include small areas of other soil units. For this reason, they serve well as first approximations of soil conditions at a given site, but a truer understanding of soils requires further investigation through inspection of soil profiles in pits, an electromagnetic induction or conductance survey, and/or systematic soil sampling and analysis.
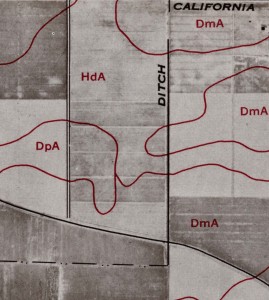
Fig. 1. USDA soil survey map. Source: Soil Survey of Eastern Stanislaus Area, California, U. S. D. A. Soil Conservation Service, 1957.
Our use of soil surveys begins with soil maps. On them, locate your vineyard and identify the soil mapping units there, which are identified as three digit numbers or a series of two or three letters (e.g. 117 or HdA)(fig 1). Next, refer to the soil description section, which is located near the front of soil survey documents. There you will find detailed descriptions of profiles typical of the individual soil mapping units, including any limiting layers such as hardpans or claypans (table 1).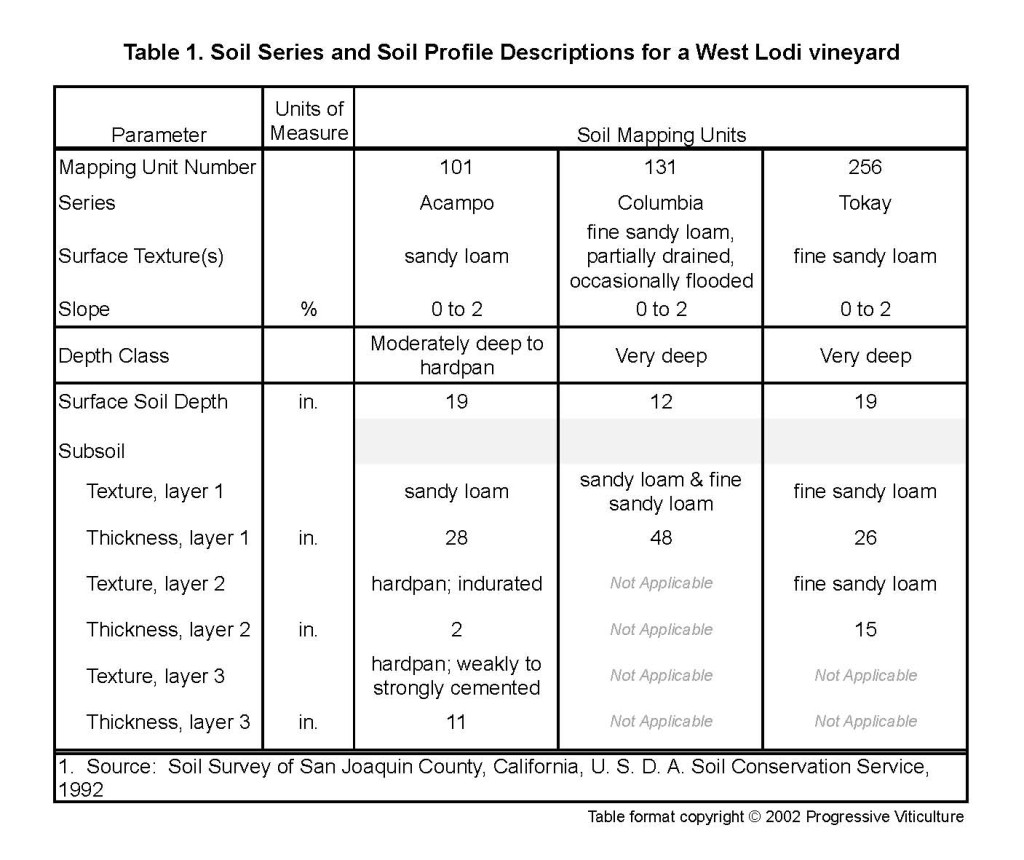 Secondary soil units and phases that occur within the primary soil mapping unit are also listed in this section. In addition, soil descriptions relate general, but essential information about soil permeability to air and water, water holding capacity, effective rooting depth, and water erosion hazard. Finally, they state the USDA Land Capability System unit and in some surveys, the Storie Agricultural Index Rating. These ratings indicate the suitability of soils for agricultural use.
Sometimes the information presented in soil descriptions is sufficient for our purpose, while other times we may wish to dig deeper. To this end, soil surveys include tabular information and descriptions of the land capability system and Storie index ratings so that we can better understand soil limitations that affect farming. The USDA Land Capability System begins with nearly ideal soils (Class I) and assigns further classes by types of limitations related to depth, texture, permeability, drainage, available water holding capacity, and other factors (table 2). 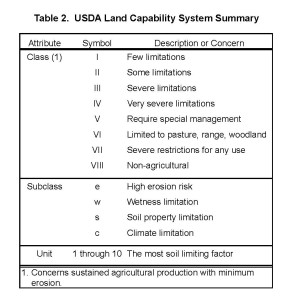 The Storie Agricultural Index Rating involves four soil properties: profile development, surface soil texture, slope, and manageable limiting factors. Multiplying the ratings of each of the four factors produces an overall rating for a soil (table 3).
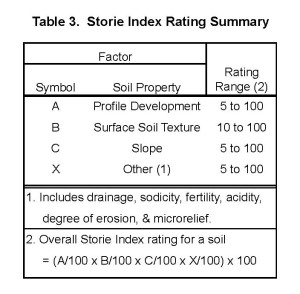
Here are two examples. Tokay fine sandy loam, which is very common in Lodi, is a Class I, Storie Index Rating 95 soil, with fertility being its only limitation. San Joaquin sandy loam, which is common east of Lodi, is a Class IVe-3, Storie Index Rating 15 soils that is limited by erosion risk, soil depth, slowly permeability subsoil, and fertility.
A word of caution: the Land Capability System and the Storie Index Rating were developed for shallow rooted annual crops (rooting depth ≤ 40 inches) and sometimes, they do not accurately represent soil conditions affecting deep-rooted perennial crops such as grapevines. They do, at least, provide a useful first approximation.
Soil surveys also provide detailed information about soil properties and soil qualities. Soil properties are describable or measurable in the field or laboratory, while soil qualities are inherent attributes inferable from soil properties or indirect observations. Texture, percent gravel, pH, salinity, organic matter, and cation exchange capacity are among soil properties, while compactibility, erodibility, and fertility are among soil qualities. Soil surveys include tables of soil properties and qualities for each layer within the profiles of soil mapping units. They also provide tabular information for other soil features critical to vineyards, such as flooding frequency, water table depths, and depth to bedrock.
In conclusion, soil surveys are our prime reference for the soils in our vineyards. While they are not a substitute for a systematic on-site survey, they serve as sound basic references as to how vineyard soils formed and how they are likely to perform.
Further Reading:
Buol, SW, Hole, FD, McCracken, RJ, Southard, RJ. Soil genesis & classification. Iowa State Univ. Press, Ames. 1997.
Reconnaissance Soil Survey of Tuolumne County, California. University of California Agricultural Extension Service. 1964.
Soil Survey of Alameda Area, California. U. S. D. A. Soil Conservation Service. 1966.
Soil Survey Amador Area, California. U. S. D. A. Soil Conservation Service. 1965.
Soil Survey of Contra Costa County, California. U. S. D. A. Soil Conservation Service. 1977.
Soil Survey Eastern Stanislaus Area, California. U. S. D. A. Soil Conservation Service. 1957.
Soil Survey El Dorado Area, California. U. S. D. A. Soil Conservation Service and Forest Service. 1974.
Soil Survey of Nevada County Area, California. U. S. D. A. Soil Conservation Service and Forest Service. 1975.
Soil Survey of Sacramento County, California. U. S. D. A. Soil Conservation Service. 1987.
Soil Survey of San Benito County, California. U. S. D. A. Soil Conservation Service. 1969.
Soil survey of San Joaquin County, California. U. S. D. A. Soil Conservation Service. 1992.
Soil Survey of Solano County, California. U. S. D. A. Soil Conservation Service. 1977.
Soil Survey Eastern Stanislaus Area, California. U. S. D. A. Soil Conservation Service. 1964.
Soil Survey of Stanislaus County, California, Western Part. U. S. D. A. Natural Resources Conservation Service. 1997.
Soil Survey of Yolo County, California. U. S. D. A. Soil Conservation Service. 1972.
Storie, RE. Storie Index Rating. University of California, Division of Agricultural Sciences Special Publication 3203. 1976.
U. S. D. A. Natural Resources Conservation Service Web Soil Survey: http://websoilsurvey.nrcs.usda.gov/app/

