 How did California become the home of the largest new world wine industry? While the answer is multifaceted, one factor looms large and that is viticultural research.
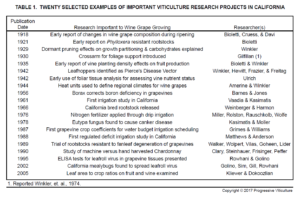
This story begins in 1880, when the state legislature passed a law that charged the University of California to undertake viticulture and enology research and issued funds for that purpose. Since that time, research efforts have broadened and deepened along with our understanding of the art and science of grape growing (Table 1). Especially since the 1960’s, the increase in volume and in some regards, quality of California viticultural research has been unprecedented. At this time, numerous California institutions and private companies are involved in viticultural experimentation.
Most viticultural research falls into one of two broad categories. The first is basic research, which addresses the scientific fundamentals of how grapevines and vineyards function. The second is applied research, which takes the knowledge gained through basic research and applies it to practical purposes. It is through applied viticultural research that science becomes technology. Obviously, our industry needs both to progress and successfully compete in a world wine market. Even so, applied research is our primary interest and in this article we will consider ways to extract value from it.
Understanding Published Research
Research reports have a standard format. They include a title, abstract, introduction, materials and methods, results, conclusions, and a list of cited publications.
Titles convey the essence of the report content and ought to indicate if the research is pertinent to our interests. To confirm its relevance, read the abstract, which is a brief report synopsis. If still in doubt, read the conclusions where experimental results are summarized and described in context with previously published research findings.
The results section is the core of a research report. In it, experimental observations are presented in tabular and/or graphical form, along with written descriptions. For most of us, converting important results from metric to English units enhances their relevancy and value. (Conversion charts and calculators are available on-line.)
The Research Process
A deepened understanding of the research process sometimes allows us to extract more value from results. The process begins with a hypothesis, such as “grape yields vary with amounts of applied water.” The researcher then designs an experiment to test the hypothesis.
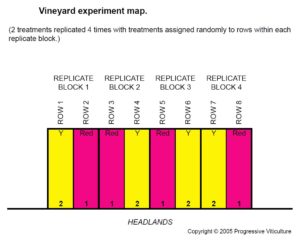
An experimental design includes a set of treatments, which for our example are water application rates (e.g. 0%, 50%, 100% and 150% ET). It also includes an arrangement of experimental units (groups of vines of a specific number) within a vineyard. In the arrangement, treatments are randomly assigned to experimental units, which reoccur a certain number of times as replicates. Such an arrangement facilitates statistical analysis of observations and measurements after the experiment is over.
Typically, evaluation of research results begins with analysis of variance (ANOVA). In it, the treatment effects are mathematically separated from some of the background variability due to uncontrollable factors like soil characteristics and vine size. The results of the ANOVA indicate if the hypothesis appears true (i.e. significant) and if so, the level of confidence associated with it. The common benchmark (significance level) is 5%, which means there is only a 5% chance that, in our example, applied water does not affect grape yields. In other words, we can be 95% confident it does.
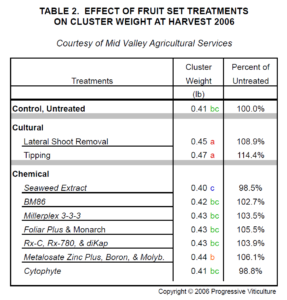
Following a significant ANOVA, treatment averages may be ranked. Several methods are available to do this, but the Least Significant Difference (LSD) is the most common. Lower case letters indicate treatment averages that differ and those that do not according to the LSD. Simply, treatment averages that share common letters are not different. Continuing with our example, average yields corresponding to 0%, 50%, 100% and 150% ET were 3 b, 6 ab, 8 a, and 7 a tons per acre. Statistically, the 3 highest average yields (6, 7, and 8 tpa) are not discernibly different because “a” follows all of them. Likewise, the difference between the two lowest averages (3 and 6 tpa) is negligible as “b” follows both. Table 2 shows an example of actual field trial results for cultural and chemical treatment effects on fruit set in Merlot (Figure 1), showing statistically significant differences in treatments as indicated by lowercase letters.
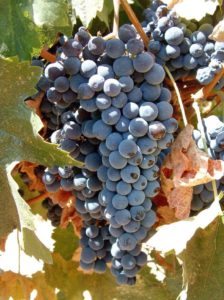
Figure 1. Merlot cluster treated with molybdenum early in bloom.
(Progressive Viticulture©)
Conducting on-site research
Of course the greatest value of research lies in using the results to improve our vineyard businesses. In some instances, as is often the case for foliar applied materials, published research findings easily transfer to commercial vineyards. In others, especially for those strongly influenced by variety and the environment, results require calibration to specific vineyard conditions. To do so, conduct on-farm trials. Refer to the materials and methods section of research reports for treatment application details so you can duplicate them.
Keep on-farm trials simple. They need not be replicated and they can be put on whole rows for easy application (Figure 2). Frequently, three treatments are sufficient, with one above and another below the one you expect will work best. For example, if you suspect 25 pounds of fertilizer nitrogen per acre is optimum, you may include 18 and 32 pound per acre treatments for comparison. Reapply treatments for a few consecutive years so you can be confident in your observations and conclusions.
Conclusions
Research remains the principal driver for technological innovation in California winegrape growing and adoption of relevant research findings will similarly drive your vineyard business.
A version of this article was originally published in the Mid Valley Agricultural Services February, 2016 newsletter, and was updated for this blog post.
The SARE booklet HOW TO CONDUCT RESEARCH ON YOUR FARM OR RANCH is available here and in print at the Lodi Winegrape Commission offices. The Commission is also hosting a workshop on Research & Development Tax Credits on October 24th. 2017 – find out more here.
References
Amerine, MA. Forward. pp. III-IX. University of California, Davis grape and wine centennial symposium proceedings. Webb, AD (ed.). University of California. 1982.
Little, TM; Hill, FJ. Agricultural experimentation. John Wiley and Sons, New York. 1978.
van Emden, HE. Statistics for terrified biologists. Blackwell Publishing, Malden, MA. 2008.
Wuest, SB; Miller, BD; Alldredge, R; Guy, SO; Karow, RS; Veseth, RJ; Wysocki, RJ. Increasing plot length reduces experimental error of on-farm tests. Journal of Production Agriculture. 7, 211-215. 1994.
Have something interesting to say? Consider writing a guest blog article!
To subscribe to the Coffee Shop Blog, send an email to stephanie@lodiwine.com with the subject “blog subscribe.”
To join the Lodi Growers email list, send an email to stephanie@lodiwine.com with the subject “grower email subscribe” or click on “join our email list” to the right.
To receive Lodi Grower news and event promotions by mail, send your contact information to stephanie@lodiwine.com or call 209.367.4727.
For more information on the wines of Lodi, visit the Lodi Winegrape Commission’s consumer website, lodiwine.com.
