TUESDAY, AUGUST 4, 2026. BY ALEXANDER MELLERSKI, WESTERN WEATHER GROUP.
California’s weather is always changing; no two growing years are exactly alike. But in many cases you’ll find similarities between years, even if you need to dive deep into the almanac. Rather than reach back through the historical record for a comparable year, it is often more useful to review recent conditions and look ahead to what the data may suggest is coming next. With that in mind, this post recaps the 2025-2026 water year and covers our outlook for the remainder of the growing season, plus the winter ahead.
Water Year Recap
The 2025-2026 water year saw some rather unusual weather while also ending up with near average rainfall. Total rainfall in Sacramento and Stockton finished at 16.86 inches and 15.17 inches, which was 93% and 113% of normal, respectively. Weather stations across the Lodi region recorded totals ranging from about 15-23 inches. All in all, everything is in line with the historical average. Long range forecasts over the course of the last year were typically calling for near to slightly below average rain for our wet season; this past year was likely a little under-predicted overall.
While the rainfall may have been “normal” for the most part, there was plenty of strange and unusual weather for the Central Valley over the course of the year. The first measurable rainfall occurred on September 25 for both Sacramento and Stockton, followed by a wet October and early November with 5-7 inches of rain falling over the period. That kind of early-season rainfall is estimated to be in the top 10% on record. This was followed by a period of rather stable weather, punctuated by the very lengthy Tule Fog event. Fog covered the Central Valley for nearly 3-4 weeks straight, with little to no clearing daily.
The fog did slow all the early-season rainfall momentum, but for the most part the remainder of winter saw typical precipitation totals. March flipped the script again with well-above average temperatures thanks to some stubborn high pressure systems. This is when we thought the majority of rainfall would be done with, and California would be stuck at a slightly below average rain total overall, but April had other plans. A couple of surprisingly strong low pressure systems rolled through and pulled the seasonal total right back up to average.
All of this was accompanied by a weak La Niña for most of the year, with a transition to ENSO neutral observed in the late winter/early spring. A stronger La Niña would have meant below average rainfall for the state, with a warmer fall/early winter and a cooler late winter/spring. As you’ll see below, that’s not the setup heading into this coming winter.
What’s Ahead the Rest of This Growing Season
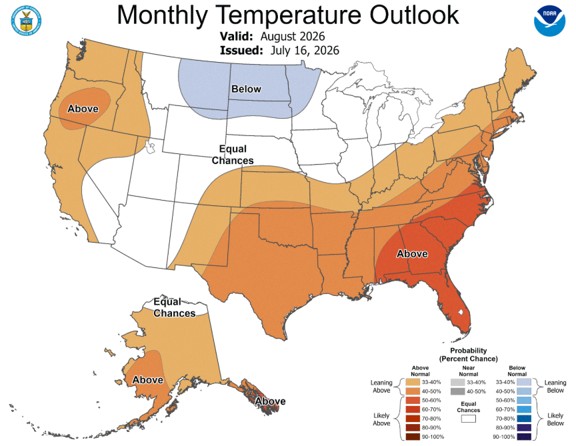
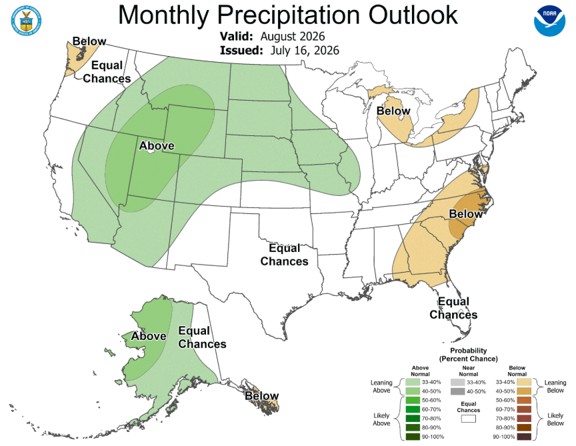
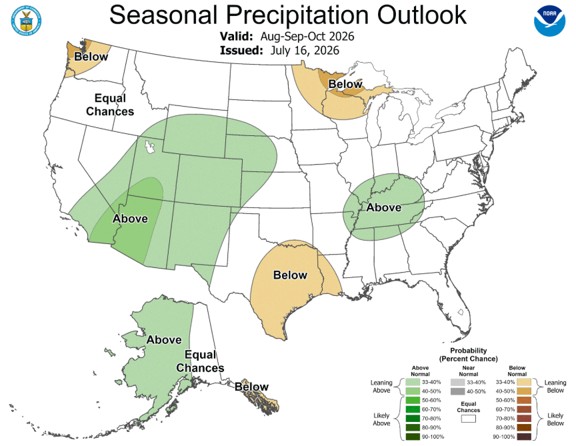
Concerning the short-term outlook (the next month or so), much of the western U.S. looks to run above average on temperature, with near to slightly above average rainfall. This appears to be in response to the establishment of high pressure over the desert southwest that will generally remain in place for a good portion of the period.
Low pressure will stay offshore and to the north. Periodically, that setup pulls moisture up from Baja California into the Desert Southwest, otherwise known by its more familiar name: the monsoon. In plain terms, a monsoon is a wind shift that changes the weather, and in this case, it means wetter conditions for the desert southwest. There is a decent chance of wet weather over the next month or so for that region. With that said, this moisture is expected to remain east of the Central Valley, but there may yet be some early season showers and even thunderstorms if things change even slightly.
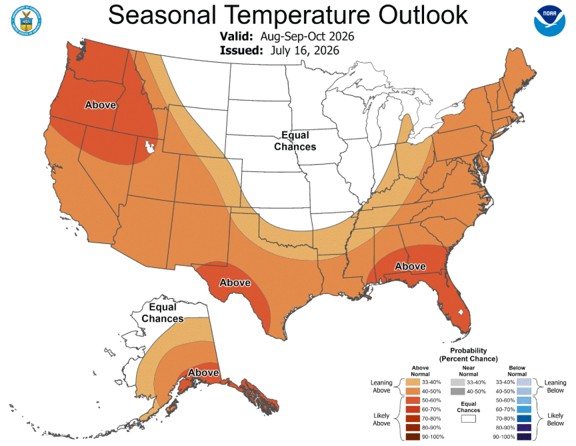
The rest of the summer and early fall paints a similar story. Notably, there is higher confidence on above-average temperatures for the pacific northwest and the expected monsoonal moisture surge shown in the above average precipitation zone in the desert southwest is focused closer to the Four Corners rather than Las Vegas. This is a bit more of a representation of the summer monsoon season, with precipitation activity much more likely for places like Arizona and New Mexico rather than southern California.
With that said, any kind of westward shift of the moisture would bring impacts to California. Look no further than what occurred in July. Moisture brought rather muggy conditions around the middle of July, as well as some blanketing cloud cover. There were even some very light showers, although most of those favored elevated terrain surrounding the valley.
Bottom line for the stretch between now and harvest: warmer than average, with the occasional moisture intrusion worth keeping an eye on.
The Bigger Story: A Strong El Niño Is on the Way
All in all, the remainder of the growing season ahead of harvest season figures to be on the warmer side, but what about the upcoming winter and spring? Here’s where things get interesting.
A strong El Niño is expected to emerge later this year and persist through the winter. The latest update from the Climate Prediction Center now shows a 97% chance of this occurring. Additionally, there is now an 81% chance of a very strong El Niño for the end of 2026 (October to December), where the temperature anomaly (the difference between the observed temperature and the long-term average baseline value) will be over 2°C/3.6°F warmer than normal. On top of that, there is even a chance that the strength of the incoming El Niño will be the strongest ever on record; those records dating back to 1950.
But what does El Niño mean for California’s wet season? Typically, El Niño will lead to above-average precipitation for California and below-average precipitation for the pacific northwest, but this is not always the case. Since 1950 there have been three very strong El Niños observed: 1982-83, 1997-98, and 2015-16. Let’s look at the annual rainfall totals for Sacramento and Stockton for those years:
| Year | Sacramento Precipitation (in.) | Stockton Precipitation (in.) |
| 1982-83 | 37.49 | 27.89 |
| 1997-98 | 32.25 | 27.50 |
| 2015-16 | 16.21 | 16.71 |
| AVERAGE | 28.65 | 24.03 |
| NORMAL | 18.14 | 13.45 |
While a very strong El Niño is anticipated, if we expand the criteria to include strong events (1.5°C/2.7°F warmer than normal), that adds another six events, shown below:
| Year | Sacramento Precipitation (in.) | Stockton Precipitation (in.) |
| 1957-58 | 31.94 | 22.75 |
| 1965-66 | 11.58 | 11.09 |
| 1972-73 | 27.14 | 23.95 |
| 1982-83* | 37.49 | 27.89 |
| 1987-88 | 15.37 | 9.98 |
| 1991-92 | 16.68 | 12.07 |
| 1997-98* | 32.25 | 27.50 |
| 2015-16* | 16.21 | 16.71 |
| 2023-24 | 17.55 | 14.15 |
| AVERAGE | 22.91 | 18.45 |
| NORMAL | 18.14 | 13.45 |
As shown by the historical records, strong El Niños will usually lead to, at a minimum, near-average rainfall for the region. Very strong El Niños also give a higher chance of well-above average rainfall. This has only happened three times in the last 75 years, but two of those three events produced nearly double the normal rainfall. Nothing can be confirmed yet of course, but signs are pointing to a wet incoming water year, with early and frequent rainfall very possible.
So where does that leave us?
In summary, after a rather unusual past year of weather, the rest of 2026 and early 2027 potentially has both a warm summer/fall and a wet fall/winter/spring. This already appears to be taking shape: this month, near to slightly above average temperatures have been prevailing, and multiple waves of monsoonal moisture will typically prevent cool mornings, which in turn will keep daytime temperatures on the warmer side.
Then the emergence of El Niño sets the stage for what could be a very wet and—yes—a potentially historic event. But this is just projection for now; we won’t know until these events unfold, and you can be sure to find out the latest from daily forecasts and weather monitoring systems at Western Weather Group!
Forecasts and data from Lodi’s network of weather stations are available to Lodi winegrowers via email and at lodi.westernweathergroup.com from Lodi’s network of weather stations, courtesy of the Lodi Winegrape Commission.
For more information regarding weather instrumentation or forecasts, or to sign up for the daily email forecast, don’t hesitate to contact Western Weather Group at info@westernwx.com, (530) 342-1700 or online at westernweathergroup.com.
References
Cline, G., Neigher, A., & Bellinder, A. (2010, August). Climate of Sacramento, California. National Weather Service. weather.gov/media/sto/pdf/CLISAC2010.pdf
ENSO Diagnostic Discussion. Climate Prediction Center. (2026, July 9). cpc.ncep.noaa.gov/products/analysis_monitoring/enso_advisory/ensodisc.shtml
NOWData. National Weather Service. (2026). weather.gov/wrh/climate?wfo=sto
Null, J. (2025, December). El Niño and La Niña Years and Intensities. Golden Gate Weather Services. ggweather.com/enso/oni.htm